The Legato IDE contains a nice feature called the Debug View, which is obviously very useful when debugging. In this blog, I will discuss the basic functionality of Debug View. It allows a programmer to view and inspect the details of variables while the target script program is running.
Friday, July 26. 2019
LDC #145: Using the Debug View
The Debug View Window
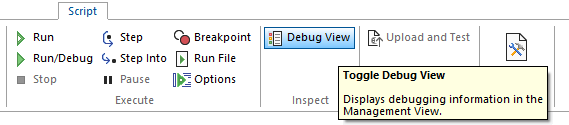
To open Debug View, select the following on the Script IDE ribbon:
The view can be opened or closed at any time including during a debug break. The view will also remain open until manually closed. When a script terminates within the IDE, the view will contain a final snapshot of the variables.
As an example, I set a break point within our ‘Full Test DVT’ we run as part of our application release checklist and placed a breakpoint in front of the main routine where it begins a test. The view appears as follows:
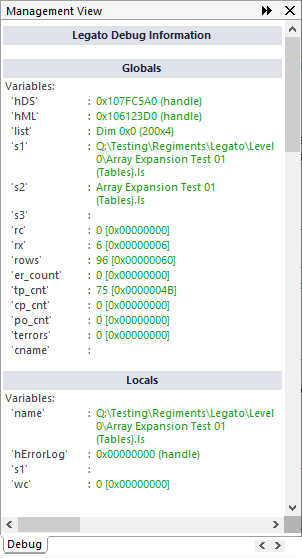
The window is divided into two sections: Globals and Locals. Each is a dump of the variable pool for the specific section. Globals represent the global static variables that are shared throughout the script while Locals are the variables locally defined within the current function. If the script being debugged does not have any functions, then only Globals will be shown.
While the script is paused at a debug breakpoint, each item can be inspected. After the script terminates, that last snapshot is shown as I said before, but the items cannot be inspected.
To inspect a variable, click on the variable name or value. The following explains each of the data types and information.
Data Types
Depending on the defined data type, the debug window will show different formats to display the data. Consider the following little program:
    char        my_char;
    byte        my_byte;
    short       my_short;
    word        my_word;
    int         my_int;
    dword       my_dword;
    long        my_long;
    qword       my_qword;

    string      my_string;
    wstring     my_wstring;
    handle      my_handle;

    my_char    = 0x41;
    my_byte    = 0x42;
    my_short   = 0x103;
    my_word    = 0x104;
    my_int     = 0x105;
    my_dword   = 0x106;
    my_long    = 0x107;
    my_qword   = 0x108;

    my_string  = "A little string.";
    my_wstring = L"A little wstring \x2116 w/Unicode";

    my_char    = 0;
You can load this program in the IDE and add a breakpoint at my_char = 0; (marked in red) using the Breakpoint (F9) function. Then press Run/Debug (F5). The Debug View can be opened and the following should appear:
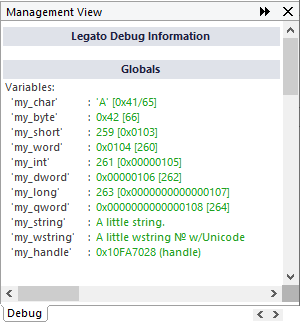
The variables are listed in the order of their declaration. If you look closely, each has a slightly different format. Let’s run down each:
| char | 8-bits | Format of character, hex/decimal. | ||
| byte | 8-bits | Unsigned, hex then decimal. | ||
| short | 16-bits | Signed, decimal then hex. | ||
| word | 16-bits | Unsigned, hex then decimal. | ||
| int | 32-bits | Signed, decimal then hex. | ||
| dword | 32-bits | Unsigned, hex then decimal. | ||
| long | 64-bits | Signed, decimal then hex. | ||
| qword | 64-bits | Unsigned, hex then decimal. | ||
| string | 8-bit series | Content, truncated, stops at zero terminator. | ||
| wstring | 16-bit series | Content, truncated, stops at zero terminator. | ||
| handle | 32-bits | Hex as handle. |
Non-Array Inspectors
If you click on any of the integers, they can be inspected in more detail:
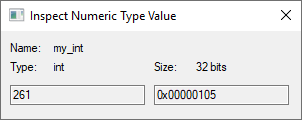
All numeric types appear as above except the char type which adds the character, if printable.
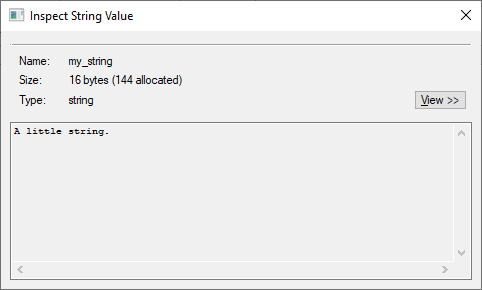
String size depends on the zero terminated length and the allocated size in characters. String inspectors appear as follows:
There is a limit as to the total number of characters that can be displayed. The view button has the following options: Native, Adjusted (returns), and Hexadecimal. Native dumps the string as is but after 65K of data is reached, the string’s display is truncated. The Adjusted option changes the returns (0x0D/0x0A) to display them in more suitable format depending on the nature of the source string. Hexadecimal dumps the content for binary inspection:
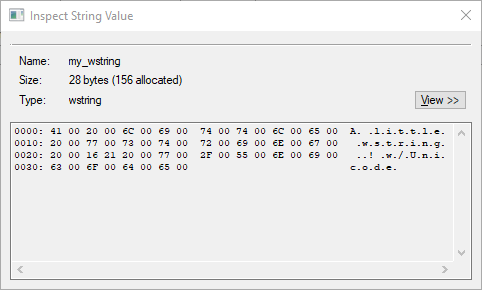
The above example is showing the Unicode string in hexadecimal format. There is also a limit to the number of bytes that can be shown.
Finally, there are handle values:
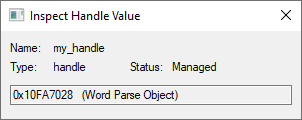
If the value is a managed handle, the Debug View inspector will resolve the handle type and owner.
Dimensional Variables
Any array, table, or matrix is displayed in the Debug View but with only its dimensional information. For example, enter this code example into the Legato IDE:
    string              a[], b[], c[];

    b["source"] = "List B";
    b["house"] = "HOUSE";
    b["barn"] = "BARN";

    c["source"] = "List C";
    c["cat"] = "-CAT";
    c["dog"] = "-DOG";
    c["house"] = "-HOUSE";
    c["barn"] = "-BARN";
    c["monkey"] = "-MONKEY";

    a[0] = "A1";
    a[1] = "A2";
    a[2] = "A3";

    a[0] = "A1";
Again, place the breakpoint on the line of code marked in red. Our display will be as follows:
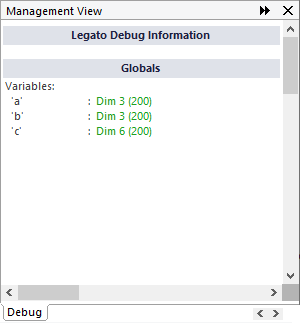
Notice “Dim 3 (200)”. That indicates a single dimension which has been allocated 200 slots and currently has three entries. For a table, one might see “Dim 20x3 (200x10)”, which shows a two-dimensional array with a total of 200x10 slots but only 20x3 of those slots currently used. For arrays not explicitly sized such as those in the example, the Legato engine always allocates array dimensionality in large parcels of slots to maximize speed and reduce re-allocating.
Clicking on 'a' shows:
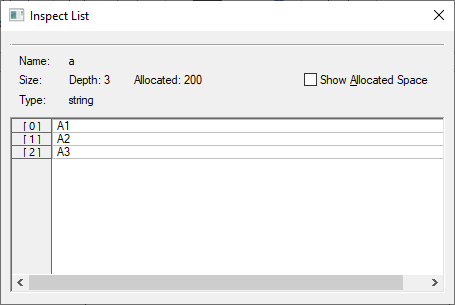
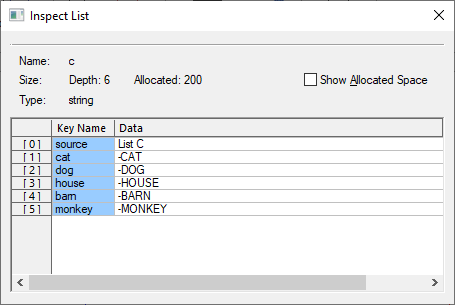
A table is loaded with the row numbers and a single column since the array is only a single dimension. Similar to the numeric inspector, the top of the window shows the name, size, and data type of the array with an option to display the entire space. If the array employs key names, they are also displayed:
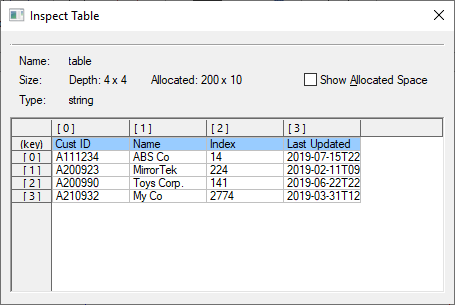
Similarly, with a table, you would see the following:
The Debug View can handle large arrays, but obviously loading one with thousands of entries can be taxing and take quite a long time. In this case, it may be preferable to try to isolate the section of the array you think may contain the error or find another way to potentially view the problem.
Conclusion
The Debug View is a valuable feature. I have found myself pulling certain code segments from scripts that are difficult to debug and placing them in a test jig so I can use the Debug View to finalize testing. For example, breakpoints cannot be placed in dialog procedures, so where possible I have coded complex functionality in subroutines that can be tested outside the confines of a dialog procedure.
Overtime we have added more functionality to the debugging features of Legato. It does not take much effort to figure out how to uses these tools, and it is well worth the investment.
 Scott Theis is the President of Novaworks and the principal developer of the Legato scripting language. He has extensive expertise with EDGAR, HTML, XBRL, and other programming languages. Scott Theis is the President of Novaworks and the principal developer of the Legato scripting language. He has extensive expertise with EDGAR, HTML, XBRL, and other programming languages. |
Additional Resources
Legato Script Developers LinkedIn Group
Primer: An Introduction to Legato


